Tuesday, August 29, 2006

21st European Photovoltaic Solar Energy Conference 4-8 September 2006

Update:

The participation capacity at the 21st European Photovoltaic Solar Energy Conference reached with 2.500 registered delegates its limits.


Press release

Scientists expect quantum leap in solar power generation


Dresden is expecting 2,500 scientists, industry representatives and politicians from 93 countries for the world's leading solar energy conference at the beginning of September.

Munich / Dresden, 21.08.2006 – For the 21st time, scientists, politicians and industry representatives will be meeting for the European solar energy conference at the beginning of September. After Rome, Paris and Barcelona, this year's European Photovoltaic Solar Energy Conference and Exhibition (EU PVSEC) will be taking place in Dresden. Holding the exhibition in Germany has great symbolic power, as Germany presently accounts for 60% of the worldwide market. The organiser of the conference, which is supported by various bodies including UNESCO, the European Commission, the German Ministry for the Environment and the European Photovoltaic Industry Association (EPIA), is expecting 2,500 participants from over 90 countries.

"The drastic increase in oil prices and the growing awareness of business, politics and consumers with regard to the limited availability of fossil fuels has given the photovoltaics sector enormous momentum and has also greatly accelerated the innovation loop," explains Dr Heinz Ossenbrink, Technical Programme Chairman of the Conference and Head of the Renewable Energy Department of the Institute for Environment and Sustainability at the EU's Joint Research Centre in Ispra, near Milan. The boom in the sector, which brought about worldwide turnover of EUR 5.8 billion last year with a growth rate of 40%, has most recently led to a global shortage of the raw material, silicon.

This year's conference programme reflects latest developments in research and on the market. Technological progress with higher levels of efficiency, a reduced demand for silicon for the manufacture of solar cells, and a lower overall use of materials in the manufacturing process form some of the main themes of this year's conference. Scientists around the world are working on solar cells which can be produced entirely without silicon, which is a scarce commodity.

Germany is a heavyweight on the international solar energy market. As early as 1989, the first promotional programme was launched there. Germany's decision to stop using nuclear power and the determination to meet the Kyoto goals on climate protection, were the framework conditions under which for example the german Renewable Energy Sources Act came into being. Research institutions and industry have achieved a leading international position in this area. According to Dr Ossenbrink, there are few research programmes which can demonstrate comparable scientific and economic success.

For a long time, solar energy was reputed to be too expensive. However, surge current is meanwhile being sold on national energy exchanges at prices above the legally guaranteed feed-in tariffs. This was the case for the first time on the Leipzig energy exchange on 27th July. On that day, a kilowatt hour of peak load electricity cost 54 eurocents. In Germany, under the terms of the Renewable Energy Sources Act, a kilowatt hour of solar energy costs 40.6 - 51.8 eurocents. According to Dr Ossenbrink the viability threshold has already been reached in southern Europe. The continuing rise of energy prices will reinforce this development. Dr Ossenbrink is convinced that "in five to ten years, regarding surge current solar energy will be cost-effective". He sees this year's solar energy conference in Dresden as a turning point in the industry's development.

Overall, seven Topics will be addressed at this year's European Photovoltaic Solar Energy Conference and Exhibition: fundamentals, new components and Materials; crystalline silicon solar cells and material technologies; matters relating to the use of amorphous and microcrystalline silicon; thin-film technology; components of PV systems; grid-coupled systems and applications, and global aspects of solar energy generation. The latest trends in the photovoltaics industry will be explored within a PV Industry Forum, which is being organised by the European Photovoltaic Industry Association EPIA and WIP Renewable Energies on the third day of the EU PVSEC conference.

The biggest photovoltaics exhibition in the world to date will be taking place parallel to the Conference. Around 400 exhibitors from 29 countries, in a show space of 16,000 sqm will be showing research findings, new production techniques and new products in the area of solar energy generation. Explaining the positioning of the exhibition, Peter Helm, Managing Director of the project developer WIP-Renewable Energies, which has been organising the EU PVSEC since 1986, says that the exhibitors are "manufacturers of photovoltaic components such as ingots, wafers, cells and modules". He goes on to mention "the group of leading system suppliers. The second group of exhibitors, almost the same in number as the first, comes from the supply industry and plant construction, who build the production facilities for the manufacture of components. As such, the EU PVSEC covers all links on the value chain from basic research to the finished product, in a single exhibition."

The EU PVSEC 2006 is supported by the UNESCO, the World Council for Renewable Energy (WCRE), the European Commission, the European Photovoltaic Industry Association (EPIA), the German Ministry for the Environment, Nature Conservation and Nuclear Safety, the German Solar Industry Association (BSW e.V.) and the City of Dresden.
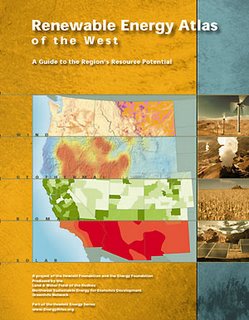
Solar energy Map of the WEST (USA that is)


I was looking for information of Solar Energy and Solar panels and came across this site, Renewable Energy Atlas of the West . It is very good informative site and anyone who is interested should visit this site. There is an interactive energy map that allows user to plot western USA for SOLAR, BIOMASS and GEOTHERMAL, power production.
Purpose of the site as stated on the site is;
Utilizing state-of-the-art GIS technology, the Atlas brings together the best existing renewable resource maps and data into a single comprehensive, publicly available document and interactive Web site. It does not provide a new regional assessment of renewable resources, but rather shows the current understanding of these resources throughout the West and highlights the issues affecting their development. In addition, it identifies areas where new data are needed in order to more accurately represent the region's renewable energy resources.

While the maps contained in this Atlas do not eliminate the need for on-site resource measurement, they can help developers gain a better understanding of where the best renewable resource areas are found and screen out the less promising areas. This can significantly minimize the cost and time involved in prospecting. Landowners can use the information for a first-cut feasibility analysis of using renewable resources to supply electrical power to their homes, farms, ranches and businesses, while policymakers will find it a useful tool for broader planning purposes.

Here is their take on SOLAR;

Solar

Solar Maps - Data Sources

National Renewable Energy Laboratory, 2002

George, R., and E. Maxwell, 1999: "High-Resolution Maps of Solar Collector Performance Using Climatological Solar Radiation Model," Proceedings of the 1999 Annual Conference, American Solar Energy Society, Portland, ME.

Maxwell, E., R. George and S. Wilcox: "A Climatological Solar Radiation Model," Proceedings of the 1998 Annual Conference, American Solar Energy Society; Albuquerque, NM.

Marion, W. and S. Wilcox, 1994: "Solar Radiation Data Manual for Flat-plate and Concentrating Collectors." NREL/TP-463-5607, National Renewable Energy Laboratory, 1617 Cole Boulevard, Golden, CO 80401.

Details: This map provides annual average daily total solar resource information on grid cells of approximately 40 km by 40 km in size. The insolation values represent the resource available to a flat plate collector, such as a photovoltaic panel, oriented due south at an angle from horizontal equal to the latitude of the collector location. This is typical practice for PV system installation, although other orientations are also used.

The map was developed with data derived from the Climatological Solar Radiation (CSR) model. The CSR model was developed by the National Renewable Energy Laboratory for the US Department of Energy. Specific information about this model can be found in Maxwell, George and Wilcox (1998) and George and Maxwell (1999). This model uses information on cloud cover, atmospheric water vapor and trace gases, and the amount of aerosols in the atmosphere, to calculate the monthly average daily total insolation (sun and sky) failing on a horizontal surface. The cloud cover data used as input to the CSR model are an 8-year histogram (1985-1992) of monthly average cloud fraction provided for grid cells of approximately 40 km x 40 km in size. Thus, the spatial resolution of the CSR model output is defined by this database. The data are obtained from the National Climatic Data Center in Asheville, North Carolina, and were developed from the US Air Force Real Time Nephanalysis (RTNEPH) program. Atmospheric water vapor, trace gases, and aerosols are derived from a variety of sources, as summarized in the references. The procedures for converting the modeled global horizontal insolation into the insolation received by a flat plate collector at latitude tilt are described in Marion and Wilcox (1994).

Where possible, existing ground measurement stations are used to validate the model. Nevertheless, there is uncertainty associated with the meteorological input to the model, since some of the input parameters are not available at a 40 km resolution. As a result, it is believed that the modeled values are accurate to approximately 10% of a true measured value within the grid cell. Due to terrain effects and other microclimate influences, the local cloud cover can vary significantly even within a single grid cell. Furthermore, the uncertainty of the modeled estimates increases with distance from reliable measurement sources and with the complexity of the terrain.

After acquisition from NREL, Greenlnfo Network smoothed the data by interpolating a grid using the centroids of the 40 km cells as data points using a inverse distance weighted function. The annual average of the daily solar radiation were used, as described above. The raster resolution of the interpolated grid was 3 km. These data were then smoothed using an averaging filter to simplify data and improve map legibility.

Solar Generation Potential Estimates
These estimates represent a possible scenario of the energy that could be generated from distributed solar photovoltaic installations, as opposed to centralized power stations, based on simple assumptions limiting their maximum deployment:

1. Solar power producing systems can be installed on rooftops and open spaces representing 0.5% of the total area of each state.

2. Solar panels will occupy 30% of the area set aside for solar equipment, with the balance taken up by support structures, access paths and other equipment.

3. Solar energy can be converted to electricity at an average system efficiency of 10%. Although crystalline silicon photovoltaic modules have demonstrated efficiencies as high as 22.7% under laboratory conditions, commercially viable systems average much lower, particularly when total system efficiencies are considered. In addition, heat can have a major impact on panel efficiencies in a real world setting, typically leading to a derating of 10% or more in sunny environments. Reliance on other forms of solar electrical production, using concentrating photovoltaic collectors or solar thermal systems, would introduce a very different set of assumptions and results.

The results represent theoretical potentials, moderated by these simple constraints, and do not take economic realities into account. Market conditions, local environmental considerations, and future developments in solar technologies and other energy sources will ultimately determine the economic viability of solar penetration at these levels.

Monday, August 28, 2006

Technorati Profile

Sun always shines in California!

In a week that saw California Governor Arnold Schwarzenegger sign the $3.35 billion Million Solar Roofs Bill into law - solidifying the nation's largest solar energy program - solar industry leaders announced that Solar Power 2006 is projected to easily become the largest solar event in US history.
The conference program features the following keynote speakers: Michael Peevey, president of the California Public Utilities Commission and architect of the California Solar Initiative; Vinod Khosla, founder of Sun Microsystems and clean tech investor; Celeste Migliore, manager of Toyota Motor Corporation's hybrid division; and (invited) California Governor Arnold Schwarzenegger, who on Monday signed the $3.35 billion Million Solar Roofs Bill into law.

Special events will include a networking reception at the Tech Museum of Innovation, which features hands-on and interactive exhibits including "Green by Design". The conference will also host a "Celebrating Solar Innovation" wine and food pairing reception, featuring wines from vineyards that have installed solar photovoltaics on their facilities, as well as a tour of local solar installations.

Pacific Gas and Electric is the lead sponsor and host for Solar Power 2006. Other sponsors to date include Sharp Solar, Kyocera, Piper Jaffray, Yingli Solar, BP Solar, SunPower Corporation, Applied Materials, Dupont, SCHOTT Solar, PowerLight Corporation, Akeena Solar, Sacramento Municipal Utility District, SPG Solar, Kaco Solar, Conergy, , REgrid Power, California Energy Commission, Cruise Car, Salt River Project, Silicon Valley Power, Stoel Rives, SolarCity, Uni-Solar, SolarWorld, Spire Corporation, and WorldWater and Power,.

Register for the conference here.